What is Value at Risk?
 Written by Sonal Sharma - Mon, 10 Mar 2025
|
What is the maximum I can lose on this investment? This is a question that almost every investor who has invested or is considering investing in a risky asset asks at some point in time. Value at Risk tries to provide an answer, at least within a reasonable estimate. In fact, it is misleading to consider Value at Risk, or VaR as it is widely known, to be an alternative to risk adjusted value and probabilistic approaches. |
||||||||||||||
|
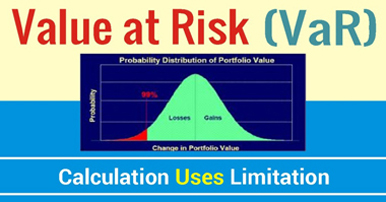
In Lay man terms Value at Risk measures largest loss likely (in future) to be suffered on a portfolio position over a holding period with a given probability (confidence level). VAR is a measure of market risk, and is equal to one standard deviation of the distribution of possible returns on a portfolio of positions. |
||||||||||||||
|
Value-at-risk (VaR) is a Probabilistic Metric of Market Risk (PMMR) used by banks and other organizations to monitor risk in their trading portfolios. For a given probability and a given time horizon, value-at-risk indicates an amount of money such that there is that probability of the portfolio not losing more than that amount of money over that horizon. |
||||||||||||||
|
Value at Risk Measures: 1. The Amount of Potential Losses 2. The chance of that loss 3. The Time Frame of the Loss Calculation, Significance and Use of Value at Risk (VaR) Measures Value at Risk is one unique and consolidated measure of risk, which has been at the center of much expectations, popularity and controversy. It is also referred to as a summary statistic which quantifies the asset or portfolio’s exposure to market risk. It has been in the news for many wrong reasons as much popularity it gained among the financial market dealers since 2008 wall street crash. Later economists and analysts have been able to develop more comprehensive and reliable VaR stats but the basic characteristic of all the measure remains the same or at least they are derived from Traditional VaR statistic. Here we will take a look at what are the qualities which made this statistic gain popularity and notoriety at the same time. Features of Value at Risk (VaR): Given below are features of Traditional VaR estimate:
The choice of confidence level is usually based on the industry requirements or reporting norms suggested by the Regulators. Choice of time horizon will depend on the type of asset being analyzed, for example:
It is important to note that VaR comparison between two portfolios, business lines or assets requires that the two variables, i.e. time horizon and confidence level, be consistent for all the portfolios being compared. Calculating Value at Risk (VaR) The methods used for calculating VaR actually hold the key to the reliability of the estimate. Also, various methods can be used to calculate the possible value at risk on the same time horizon, depending on the availability of the data. For example: If VaR is calculated for a very short horizon, say intraday, amount of data may be too small to provide a consistent or reliable answer, but it may not be possible to include additional actual data (due to trade changes or other restrictions). In such cases sample size has to be artificially increased using methods of re-sampling to create enhanced view of the current situation and increase the reliability of the VaR. Methods to Calculate VaR: Starting from the basic methods we shall move to more complex ones, readers should keep in mind that the examples provided in the article do not constitute any advice or a real life scenario. They are meant only to provide a basic understanding and general idea about the framework of VaR calculations. Real life solutions may be a lot more complex. Historical Method This is the most basic of all, and perhaps the simplest to use as well, though it carries a few disadvantages for the analyst:
As we can see there are 30 set of values provided here indicating daily returns on a stock. To calculate VaR through this method simply arrange the returns in ascending order and count –
In counting method as VaR is going to measure portfolio risk, we can round the values to the next or nearest standard value, therefore:
To see how the distribution appears or to check the normalcy of the distribution we can use the Data Analysis tool pack in excel to create a frequency table like the one prepared below:
And then plot it on the chart:
Figure 1: Distribution of Historical Returns Interpretation of Historical VaR Going forward VaR can be interpreted in two ways: 1. As minimum loss possibility, for example: 5% VaR for the above example can be put like this- “there is 5% chance for the portfolio of incurring a loss of 3.99% of the total portfolio value in a day or say tomorrow (only in case of daily VaR).” 2. As a confidence level measure, for example: “for the same 5% VaR it can be said that there is 95% chance that the portfolio will not lose more than 3.99% of its total value in a day’s trade.” The second interpretation is the one majorly used by portfolio managers, and can sometimes be misleading as it ignores the higher loss percentages on the left tail of the measured VaR, that is why, most of the times regulators and other market supervisors prefer to look at both 5% and 1% VaR measures instead of just either one of them. Calculating VaR for a Portfolio: To calculate VaR for a portfolio which consists of multiple securities or assets, the best way is to calculate individual asset distributions for the period say ‘daily’ and then calculate relative portfolio values for each day. Afterwards, these consolidated portfolio return can be distributed just like the historical data above to calculate portfolio VaR. Example: Suppose the returns taken in the example above are end of the day results of stocks A, B, C and D with respective initial weights of 20%, 30%, 10% and 40% respectively. Then before we can calculate VaR for the portfolio we need to assess the individual asset returns and their weighted impact on the overall portfolio:
Table: The weighted portfolio return can be plotted for Historical VaR calculation of the portfolio distribution. Uses of Value at Risk (VaR) VaR has four main uses in finance:
VaR is sometimes used in non-financial applications as well. The greatest benefit of VAR is that it imposes a structured methodology for critically measuring risk. Institutions that go through the process of computing their VAR are forced to keep a check on their exposure to financial risks and to set up a proper risk management function. Thus, the process of getting to VAR may be as important as the number itself. The other benefit of VaR is that it allows organizations to divide risk in two parts.
"A risk manager has two jobs: make people take more risk the 99% of the time it is safe to do so, and survive the other 1% of the time. VaR is the border. So by using VaR the limit of the Risk that can be undertaken is defined. In the early 1990s, three events dramatically expanded use of value-at-risk:
Criticism of VaR VaR is compared to "an airbag that works all the time, except when you have a car accident." The major criticism of VaR is:
Limitation of VaR These are some common limitations of VaR:
To know more about Value at Risk and Risk Management Measures you can pursue the Accredited Financial Analyst Designation Program of AAFM USA. To know more Fill the: ‘Join US’ Form on this Page Please leave your Comments below and If you found this article Helpful Share it on Social Media. Important Links Additional Reading:
|


Author by
Comments (0)
Search
Popular categories
Wealth Management
7Finance
7Financial Planning
6Finance Certifications
4Investing
3Financial Statements
2Latest blogs

Discover the Power of a Private Family Trust in India!
Sat, 15 Mar 2025 0 285

9 Surprising Things You Should Never Include in Your Will (And What to Do Instead)
Sat, 15 Mar 2025 0 204

Why Indian Investors Are Flocking to Factor-Based Passive Funds?
Sat, 15 Mar 2025 0 201
Write a public review