FINANCIAL STATEMENT ANALYSIS (FSA) DEMISTIFIED
 Written by Sonal Sharma - Mon, 10 Mar 2025

FINANCIAL STATEMENT ANALYSIS (FSA) DEMISTIFIED
What is Financial Statement Analysis?
Financial Statement Analysis (FSA) is the diagnostic and investigative study of Financial Statements in order to take logical business decisions. Financial Statement Analysis takes the raw financial information from the financial statements and turns it into usable information the can be used to make decisions. The three types of analysis are horizontal analysis, vertical analysis, and ratio analysis. Each one of these tools gives decision makers a little more insight into how well the company is performing.
To understand Financial Statement Analysis or FSA we must first learn about the Financial Statements.
FINANCIAL STATEMENTS
Financial statement is a report which describes the financial health of a company. Financial statements are usually compiled on a quarterly and annual basis and provide useful financial information to the user of financial statement. Financial statements are often audited by government agencies, accountants, firms, etc.
Financial statements for businesses usually include
A. The Balance Sheet portrays the financial position of the organization at a particular point in time. It shows what you own (assets), how much you owe to vendors and lenders (liabilities), and what is left (assets minus liabilities), known as equity or net worth). A balance sheet is a snapshot of the company's financial position as of on a certain date. The balance sheet equation can be stated as:
B. The Income Statement, on the other hand, measures the operating performance for a specified period of time (e.g., for the year ended December 31, 2001). If the balance sheet is a snapshot, the income statement is a motion picture. The income statement serves as the bridge between two consecutive balance sheets. Simply put, the balance sheet indicates the wealth of a company and the income statement tells you how a company performed last year. The balance sheet and the income statement tell different things about a company. For example, the fact the company made a big profit last year does not necessarily mean it is liquid (has the ability to pay current liabilities using current assets) or solvent (noncurrent assets are enough to meet noncurrent liabilities). A company may have reported a significant net income but still have a deficient net worth. In other words, to find out how an organization is doing, you need both statements. The income statement summarizes your company's operating results for the accounting period; these results are reflected in the equity (net worth) on the balance sheet. This relationship is shown in Exhibit1
C. Statement of Retained Earnings, also called statement of changes in equity reflects the change in company’s retained earnings over the reporting period. Items included in the statement of retained earnings include profits or losses from operations, dividends paid, shares issued or redeemed during the period, and any other items charged or credited to retained earnings.
D. The Statement of Cash Flows provides useful information about the inflows and outflows of cash that cannot be found in the balance sheet and the income statement.
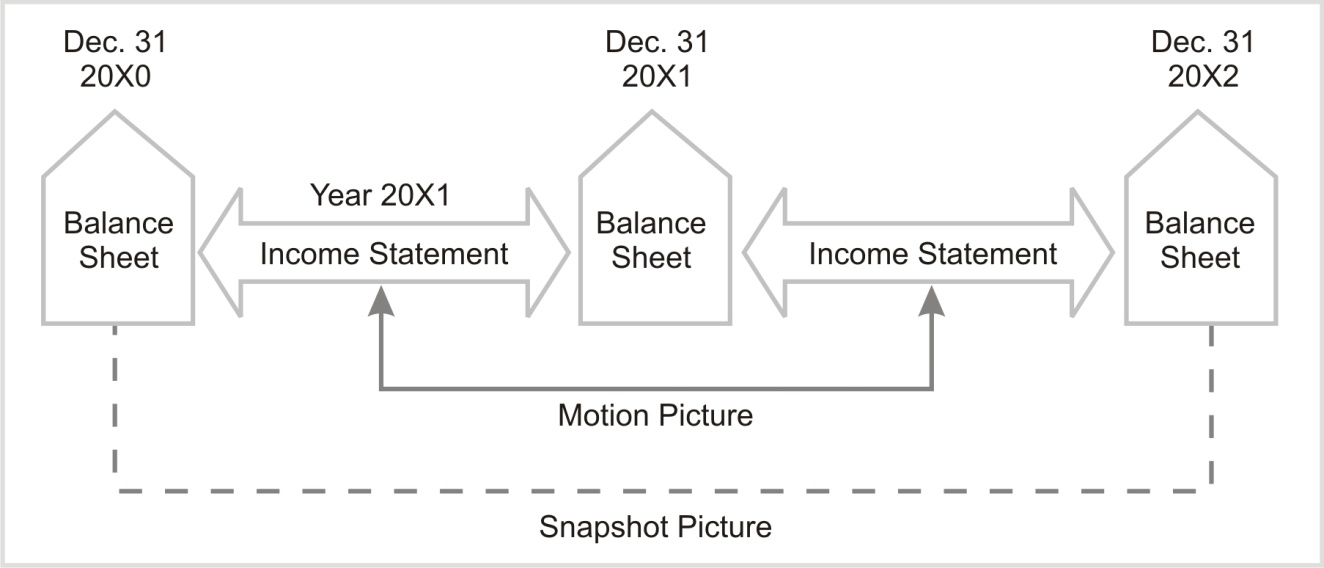
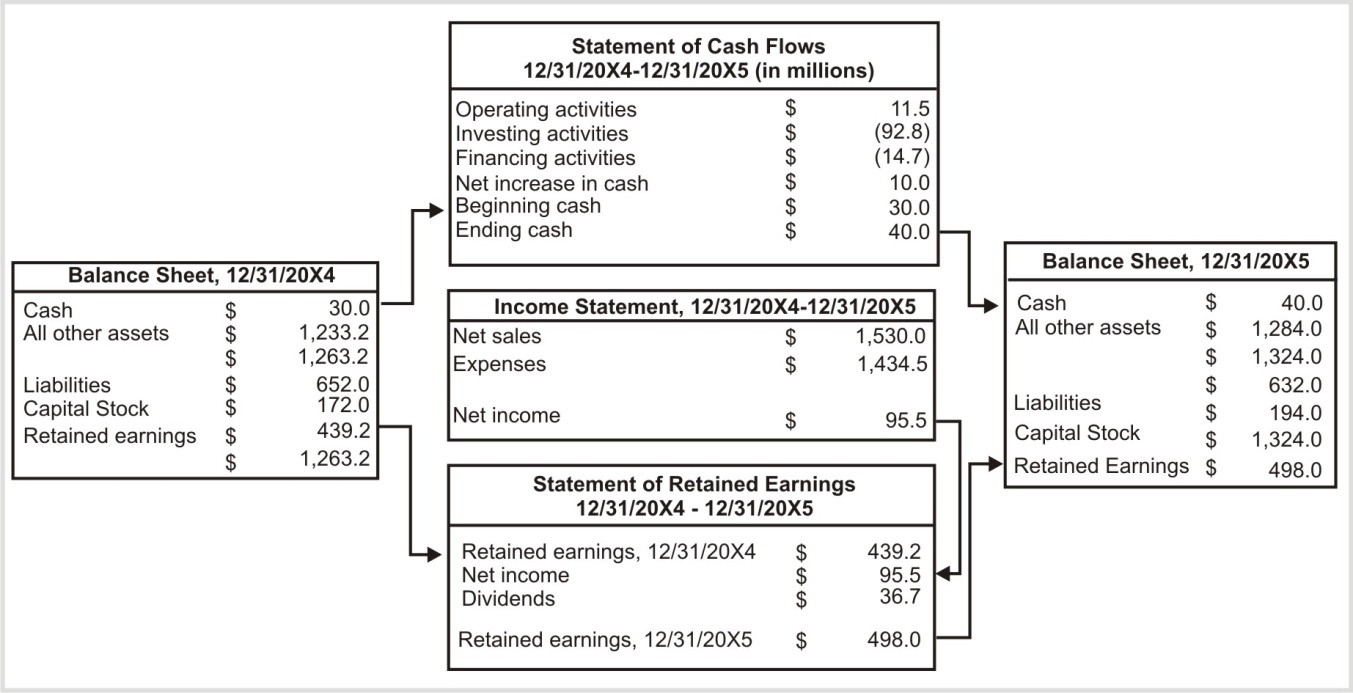
Exhibit 2 shows how these statements, including the statement of retained earnings, tie together with numerical figures.
Note: The beginning amount of cash ($30 million) from the 20x4 balance sheet is added to the net increase($10 million) or decrease in cash (from the statement of cash flows) to arrive at the cash balance ($40 million) as reported on the 20x5 balance sheet. Similarly, the retained earnings balance as reported on the 20x5 balance sheet comes from the beginning retained earnings balance (20x4 balance sheet) plus net income for the period (from the income statement) less dividends paid. As one studies financial statements, these relationships become clearer and as a Financial Analyst you will understand the concept of articulation better.
FINANCIAL STATEMENT ANALYSIS
Financial Statement Analysis (FSA) can also be defined as the process of identifying financial strengths and weaknesses of the firm by properly establishing relationship between the items of the balance sheet and the profit and loss account.
Financial Ratios and Financial Statement Analysis emphasizes on the influence of financial analysis in business. The important figures in a financial statement are intertwined by many a relationship. It helps the analyst in comprehending these relationships and how each one plays its vital role in understanding a business’s growth, performance, scalability and other zones of it.
Any financial statement is known to be used in three main steps for analysis.
The first is to find out the relevant information from all the available data which helps in decision making.
The second is to organize the selected information in order to emphasize on the relationships that exist between the crucial figures in a financial statement.
The third is to draw conclusions, infer and evaluate the processed information for final results.
Financial statement analysis, seeking to describe and explain:
- The demand and supply forces underlying the provision of financial statement data.
- The properties of numbers derived from financial statements.
- The key aspect of decision that use financial statement information.
- The features of the environment in which these decisions are made.
METHODS OF FINANCIAL STATEMENT ANALYSIS
There are various methods or techniques that are used in analyzing financial statements, such as:
1. Comparative Statements
2. Common Size Percentages
3. Trend Analysis
4. Ratios Analysis.
Financial statements are prepared to meet external reporting obligations and also for decision making purposes. They play a dominant role in setting the framework of managerial decisions.
Analysts work in a variety of positions. Some are equity analysts whose main objective is to evaluate potential equity (share) investments to determine whether a prospective investment is attractive and what an appropriate purchase price might be. Others are credit analysts who evaluate the creditworthiness of a company to decide whether (and with what terms) a loan should be made or what credit rating should be assigned. Analysts may also be involved in a variety of other tasks, such as evaluating the performance of a subsidiary company, evaluating a private equity investment, or finding stocks that are overvalued for purposes of taking a short position.
FINANCIAL STATEMENT ANALYSIS PROCESS:
The process of Financial Statement Analysis Consists 3 major Steps:
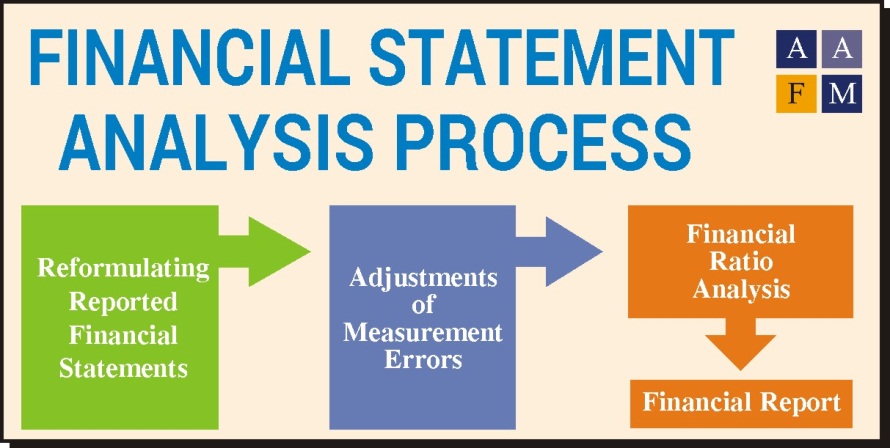
1. Reformulating Reported Financial Statements: Reformulating reported financial statement is restating financial statement in such a way that financial statements serve the purpose of analysis better and allows to more efficiently and accurately interpret the performance of the company. In case of income statement reformulation takes form of dividing reported items into recurring and non-recurring items, separating earnings into core and transitory earnings. In case of balance sheet reformulation takes form of breaking the balance sheet items into operating assets/liabilities and financial asset/liabilities. For cash flow statements removing financing activities(for example interest expense) from cash flow from operations etc.
2. Adjustments of Measurement Errors: Adjustment of measurement errors is done to remove the noise present in the input data to enhance the quality of the reported accounting numbers. For example removing the R&D expenses from the income statement and showing in the balance sheet.
3. Financial Ratio Analysis on the Basis of Reformulated and Adjusted Financial Statements: Conducting ratio analysis on the adjusted financial statements involves calculating various ratios to derive insight about the performance of a company.
The detailed process of conducting financial analysis is summarized in Exhibit 3
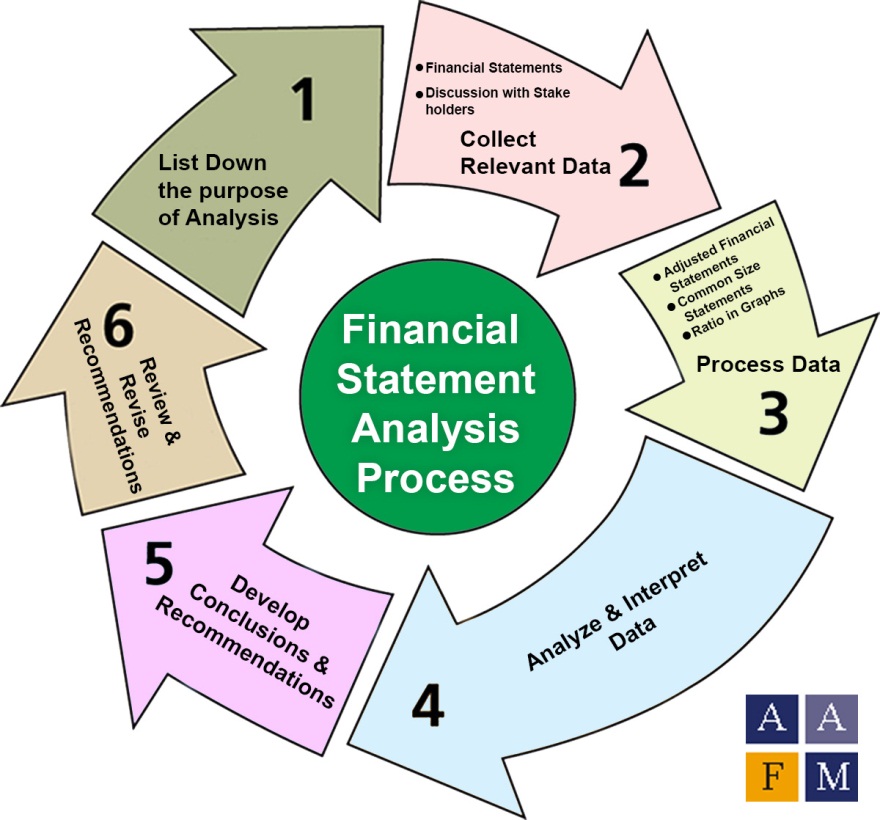 Exhibit 3 Financial Statement Analysis Framework
|
|
Phase |
Sources of Information |
Output |
|
1. |
Articulate the purpose and context of the analysis. |
The nature of the analyst’s function, such as evaluating an equity or debt investment or issuing a credit rating. Institutional guidelines related to developing specific work product. |
Statement of the purpose or objective of analysis A list (written or unwritten) of specific questions to be answered by the analysis. Nature and content of report to be provided Timetable and budgeted resources for completion. |
|
2. |
Collect data |
Financial statements, other financial data, questionnaires, and industry / economic data. Discussions with management, suppliers, customers, and competitors, Company site visits (e.g., to production facilities or retails stores). |
Organized financial statements. Financial data tables. Completed questionnaires, if applicable |
|
3. |
Process data |
Data from the previous phase, |
Adjusted financial statements, Common-size statements. Ratios and graphs. Forecasts. |
|
4. |
Analyze / interpret the processed data. |
Input data as well as processed data. |
Analytical results. |
|
5. |
Develop and communicate conclusions and recommendations (e.g., with an analysis report). |
Analytical results and previous reports. Institutional guidelines for published reports. |
Analytical report answering questions posed in Phase 1. Recommendation regarding the purpose of the analysis, such as whether to make an investment or grant credit. |
|
6. |
Follow up. |
Information gathered by periodically repeating above steps as necessary to determine whether changes to holdings or recommendations are necessary. |
Updated report and recommendations. |
ATTRIBUTES OF GOOD FINANCIAL STATEMENT ANALYSIS
- 1. Objectivity: Results of financial statement analysis should be analyzed objectively to reduce the possibility of any behavioral bias to minimum.
- 2. Precision and Brevity: Financial statement analysis should done with precision and should provide relevant information in concise form.
- 3. Understandability: Information provided by financial statement analysis should be presented in such a way that the analysis fosters understandability.
- 4. Relevance: Analysis of financial statement should be relevant to the purpose of the analysis. Financial statements used in analysis should be timely and should have a predictive value.
- 5. Reliability: The information derived from the analysis of financial statement must be free of material error and bias and should provide full and fair disclosure of the financial performance and other relevant information.
USERS OF FINANCIAL STATEMENTS ANALYSIS
- 1. Creditors: Creditors are concerned with the company’s ability to pay interest and principal when due and are concerned with the company’s cash flow ability.
- 2. Shareholders: Shareholders provide company with the much needed capital and are interested to know company’s ability to pay dividend, and growth of dividends and maximize shareholders wealth.
- 3. Prospective Investors: Financial statement analysis is used by the prospective investors to evaluate the attractiveness of the investment in the business.
- 4. Management: Management uses financial statement analysis to analysis the efficiency of operations and make important business decisions. For example whether or not to continue or discontinue part of its business, to make or buy certain material, or to acquire or rent/lease certain equipment.
- 5. Regulatory Authorities: For publicly traded companies, financial statements are analyzed to ensure compliance to various rules and regulations.
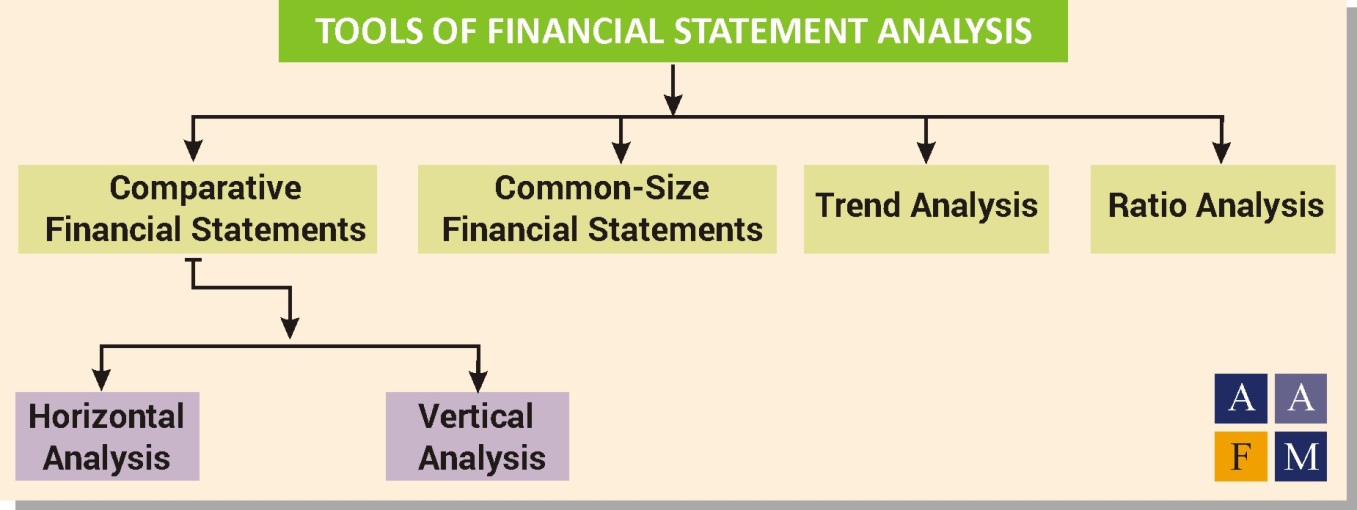
TOOLS OF FINANCIAL STATEMENT ANALYSIS
Financial statement analysis procedures fall into two basic categories:
1. Comparisons and measurements relating to financial data for two or more periods,
2. Comparisons and measurements relating to financial data of the current period.
The following analytical tools are used in Financial Statement Analysis:
1. Comparative Financial Statements: Financial statements presenting financial data for two or more periods are called comparative statements. Comparative financial statements usually give similar reports for the current period and for one or more preceding periods. Comparative statements are considerably more significant than are single-year statements.
a. Horizontal analysis: Horizontal analysis spotlights trends and establishes relationships between items that appear on the same row of a comparative statement. Horizontal analysis discloses changes on items in financial statements over time. Each item (such as sales) on a row for one fiscal period is compared with the same item in a different period. Horizontal analysis can be carried out in terms of changes in dollar amounts, in percentages of change, or in a ratio format. Horizontal analysis may be conducted for balance sheet, income statement, schedules of current and fixed assets and statement of retained earnings.
Dollar and Percentage Changes are computed by using the following formulas:
1. Dollar Change = Amount of the item in comparison year – Amount of the item in base year
2. Percentage Change = ![]()
b. Vertical analysis: Vertical analysis involves the conversion of items appearing in financial statement columns into terms of percentages of a base figure to show the relative significance of the items and to facilitate comparison. On the balance sheet, individual assets can be expressed in terms of their relationship to total assets. Liabilities and shareholders’ equity accounts can be expressed in terms of their relationship to the total of liabilities and shareholders’ equity. On the income statement, each item is stated as a percentage of sales. In a vertical analysis the percentage is computed by using the following formula:
Percentage of base = ![]()
2. Common-Size Financial Statements: Each item in the common-size statement has a common basis for comparison, for example, total assets, net sales. Common-size income statements provide information concerning what proportion of sales dollar is absorbed by cost of goods sold and various expenses. On comparative, common-size statement, the comparisons demonstrate the changing or stable relationships within groups of assets, liabilities, revenues, expenses, and other financial statement categories. Care must be exercised when such comparisons are made since the percentage change can result from a change in the absolute amount of the item or a change in the total of the group of which it is a part, or both.
3. Trend Analysis: Trend analysis indicates in which direction a company is headed. Trend percentages are computed by taking a base year and assigning its figures as a value of 100. Figures generated in subsequent years are expressed as percentages of base-year numbers.
4. Ratio Analysis: A ratio is an expression of a mathematical relationship between one quantity and another. If a ratio is to have any utility, the element which constitutes the ratio must express a meaningful relationship. Ratio analysis can disclose relationships which reveal conditions and trends that often cannot be noted by inspection of the individual components of the ratio. Typical ratios are fractions usually expressed in percent or times.
Ratios of Financial Statement Analysis
1 Current Ratio = ![]()
2 Quick Ratio = ![]()
3 Cash Ratio = ![]()
4 Defensive Interval Ratio = ![]()
5 Receivables Turnover Ratio = ![]()
6 Days of Sales Outstanding (DSO) = ![]()
7 Inventory Turnover Ratio = ![]()
8 Days of Inventory on Hand (DOH) = ![]()
9 Payables Turnover Ratio = ![]()
10 Days Payable Outstanding (DPO) = ![]()
11 Cash Conversion Cycle (Net Operating Cycle) = DOH + DSO – DPO
12 Working Capital Turnover Ratio = ![]()
13 Fixed Asset Turnover Ratio = ![]()
14 Total Asset Turnover Ratio = ![]()
15 Gross Profit Margin = ![]()
16 Operating Profit Margin = ![]()
17 Pretax Margin = ![]()
18 Net Profit Margin = ![]()
19 Operating Return on Assets = ![]()
20 Return on Assets = ![]()
21 Return on Equity = ![]()
22 Return on Total Capital = ![]()
23 Return on Common Equity = ![]()
24 Tax Burden = ![]()
25 Interest Burden = ![]()
26 EBIT Margin = ![]()
27 Financial Leverage Ratio (Equity Multiplier) = ![]()
28 Debt-to-Assets Ratio = ![]()
29 Debt-to-Equity Ratio = ![]()
30 Debt-to-Capital Ratio = ![]()
31 Interest Coverage Ratio = ![]()
32 Fixed Charge Coverage Ratio = ![]()
33 Dividend Payout Ratio = ![]()
34 ![]()
35 Earnings Per Share = ![]()
36 Book Value Per Share = ![]()
37 Free cash Flow to Equity (FCFE) = Cash flow from Operating Activities – Investment in Fixed Capital + Net Borrowing
38 Free cash flow to the firm (FCFF) = Cash Flow from Operating Activities + Interest Expenses *(1 – Tax rate) – Investment in Fixed Capital
LIMITATION OF FINANCIAL STATEMENTS ANALYSIS
1. Comparing companies with different fiscal year end can be difficult.
2. Comparing companies with different accounting methods (for example Inventory LIFO vs. FIFPO, depreciation method) can be difficult.
3. Estimates are as accurate as input and depends on the integrity of the input data.
4. Takes into account only quantitative factors and ignore qualitative factors such as efficiency, loyalty and honesty of the human resource.
5. Explanation of the results of the analysis involves human decision.
6. Data based on historical events which may not hold in future.
Financial statement analysis is an essential skill for individuals involved in investment management, corporate finance, commercial lending, and the extension of credit. Over the years, it has become an increasingly complex endeavor, as corporate financial statements have become more difficult to decipher.
The Accredited Financial Analyst Designation Program by American Academy of Financial Management USA is the highest Global Designation in Financial Analysis & Research the program comprehensively deals with Financial Analysis and gives cutting edge skills and knowledge to the participants in this complex but enticing field of Study.
If you have liked this article please share it on Social Media Platforms like Facebook, Linked In, Twitter etc.
We would like to hear more about your thoughts and comments on Financial Statement Analysis in the Comment Section Below.
Author by
Comments (0)
Search
Popular categories
Wealth Management
7Finance
7Financial Planning
6Finance Certifications
4Investing
3Estate Planning
2Latest blogs

Discover the Power of a Private Family Trust in India!
Sat, 15 Mar 2025 0 285

9 Surprising Things You Should Never Include in Your Will (And What to Do Instead)
Sat, 15 Mar 2025 0 204

Why Indian Investors Are Flocking to Factor-Based Passive Funds?
Sat, 15 Mar 2025 0 201
Write a public review